REDES SOCIAIS
Revista Científica da Ordem dos Médicos

Throughout Canada’s COVID-19 response, data use, access, and reporting have featured prominently in academic and media discourse. While there may be regional variation in data collection and analysis based on community context, all provincial agencies appeared to approach data disclosure with a desire to find a balance between transparency where a public risk of transmission existed against the need to respect the privacy and confidentiality of impacted individuals and groups.
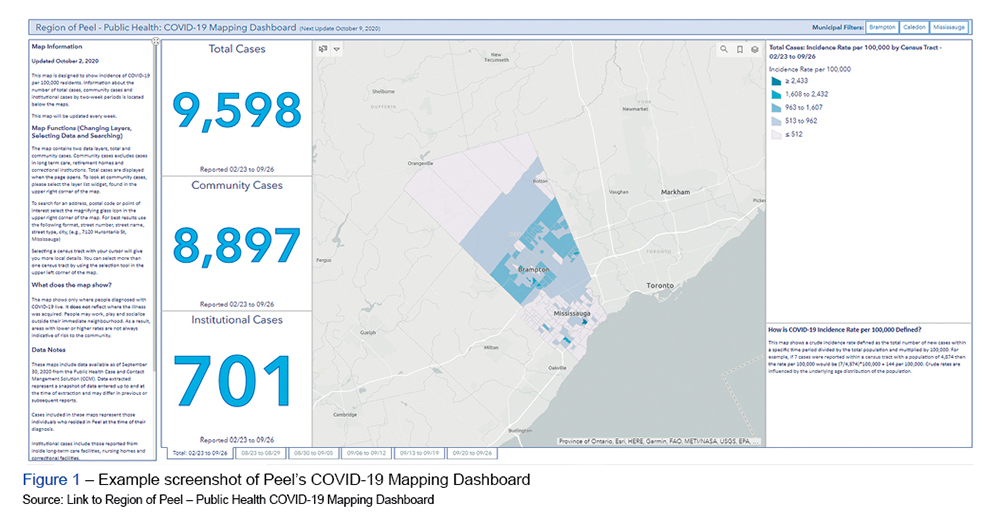
One example of data disclosed by Canadian public health agencies during the COVID-19 response revolved around the geographic distribution of COVID-19 cases. This broad theme encompassed a heterogenous collection of types of geographic data that might be publicly disclosed, ranging from maps of exposure locations to choropleth maps, a visualization tool that uses colour to illustrate spatial distribution of a variable, which can be used to compare incidence rates of different neighbourhoods.